Matched Content

Showing posts with label software. Show all posts

Thursday, December 26, 2024

ANENG AN9002 Multitester Battery Voltage Graph Interpretation


The ANENG AN9002 multitester is connected via Bluetooth to a Samsung Galaxy A04 cellphone. The display shows the car battery voltage before starting, and until the engine is running. With a Bluetooth connection, the battery voltage can be monitored remotely with a graphic display on the cellphone.

The graphic display makes the multitester functions similarly to an oscilloscope. More details about the ANENG AN9002 digital multitester.

As seen in the graph, the initial voltage of the car battery is around 12.8 volts.

The car battery voltage when the contact is in the Acc (accessories) position is around 12.7 volts.

In the On contact position, the battery voltage drops to around 12.6 volts. There is a small curve in the graph when the contact is positioned to On. This is because the fuel pump, relays, and instruments on the dashboard (fuel meter, temperature, odometer, indicator lights, etc.) are activated.

When starting the engine, the battery voltage drops to 10.56 volts.

The battery voltage then rises to 14.75 volts when the alternator is active, because the alternator is driven or rotated by the engine.

Conditions such as those in the graph above are quite normal.

Watch YouTube video about car accu voltage before and after start.


In the above video the voltage is slightly different. When engine start the voltage drops to 10.39 volts. This condition is basically still normal.


Meanwhile, in the following graph, the battery voltage can be seen to drop more deeply.


At the beginning of the graph is when the contact is in the Acc position, with a battery voltage of around 12.7 volts.

The battery voltage drops to 9.22 volts when the engine is starting.

Then the voltage rises to 14.71 volts, when engine is running. This indicates that the alternator is still working well.

Some causes of a very low or dropping battery voltage when starting, include:

  • The battery has a weak storage capacity. Although the initial voltage still looks normal at around 12.8 volts. But the battery current capacity has started to decrease. So the voltage drops when starting, due to lack of electric current. For example, the normal capacity of a battery is able to produce an electric current of 40 amperes for one hour (40 Ah, ampere-hours), generally on sedans. If the battery is old, its capacity will decrease. For example, it can only flow an electric current of 25 amps in one hour (25 Ah). Because there are dirt deposits on the battery cells, which prevents the battery cells from contacting the electrolyte (battery water).
  • Both positive and negative battery connectors have poor connections. Maybe because they are loose, or because they are dirty.
  • The starter motor is dirty. Especially in the carbon brush section. So it needs to be opened and cleaned. Dust from the carbon brushes collects. The carbon dust is an electrical conductor, and can cause internal current leakage in the starter. So that some of the electric current from the battery does not rotate the starter motor. But short circuits inside the starter.


It could also happen that the battery voltage does not drop when starting. Still above 11 volts. But the starter is difficult to turn. This could be an indication that the battery is still good. Some possible failures are:

  • The positive wire from the battery connected to the starter solenoid is loose or dirty.

  • The negative wire from the battery to the vehicle body is dirty, loose, or rusty. There is also a negative wire that is connected from the battery directly to the engine block, or from vehicle body to engine block.

  • The wire from the ignition switch to the starter solenoid is loose or dirty. Causing the solenoid not to function properly.

  • The switch in the solenoid is dirty or damaged (worn, burned). Some solenoids can be dissasembled to clean the switch contacts. While others must be replaced when faulty.


The function of the solenoid on the starter is as a relay to allow a large electric current flow directly from the battery to the starter. Because the current is very large, it cannot go through the ignition switch or other circuits on the vehicle. Large currents require large cable and connectors, and are well connected.

If the large current to the starter is resisted, the starter is unable to rotate properly, aka lack of power. And the battery only produces a small current. That is why the battery voltage not to drop much when the starter is turned on.

The solenoid also functions to shift the small gear (pinion gear) of the starter, so that it engages with the ring gear on the flywheel. So that the starter can rotate the crankshaft. When the starter does not work, the gear will be released from the flywheel. So that the starter will not rotate with the crankshaft, when the engine is running.

Signs of a bad starter solenoid include: 

  • Nothing happens when you turn the key
  • A single “click” sound from the engine compartment or under the car
  • Repeated “clicking” sounds
  • Intermittent operation
  • A spinning starter without an engaged flywheel
  • A slow-cranking engine

All symptoms of a damaged solenoid as above, are usually indicated by the battery voltage not much dropping. When the starter is turned on.

The basic principles explained in this article can also be applied to motorcycles, pickup, minibus (MPV), jeep (SUV), and other vehicles. Especially those with 12 volts electrical circuits.

Thursday, November 21, 2024

Digital Multimeter with Bluetooth Connectivity Aneng


ANENG AN9002 is a professional digital multimeter with Bluetooth connectivity, enabling remote operation and data visualization on your smartphone.  It features a large, clear LCD display and offers a variety of measurement functions, including:  

* AC/DC Voltage: Measures alternating current voltage (Volts Alternating Current, VAC) and direct voltage (Volts Direct Current, VDC). 

* AC/DC Current: Measures alternating and direct current (Ampere). 

* Resistance: Measure resistance value (Ohm) 

* Capacitance: Measures capacitance value (Farad). 

* Frequency: Measures frequency (Hertz). * Diode Test: Tests diodes and LED lights (Volt).  

* Continuity Test: Test continuity.  

* Temperature Measurement (Celsius, Fahrenheit). 

* Detection of live alternating voltage cables without touch (Non-contact Voltage, NCV). 


The Bluetooth function allows you to connect the multimeter to your smartphone and view the measurement data on a larger screen. So it is easier to read and analyze. You can also record and save measurement data for future reference.  

Watch YouTube video about car battery voltage before and after  starting the engine.


Multitester is connected to smartphone via Bluetooth. The video above also shows how to use the multitester application in Android smartphone Samsung Galaxy A04.

Bluetooth range reaches about 25 meters if there are mininum obstacles. The range is also influenced by the sensitivity of your cellphone in receiving Bluetooth signals from the multitester. Makes it easier to work in dangerous places, because it can be monitored remotely. 

The image above is a screen display of a cellphone connected by Bluetooth to the multitester. When monitoring the 12 volt battery charge voltage. With a time of more than 2500 seconds, or around 42 minutes. 

The application can be downloaded for free with the QRcode on the back of the Multitester. 


ANENG AN9002 main features include:  

* True RMS Measurement: Ensures accurate measurement of non-sinusoidal waveforms.  

* Automatic Range Selection (Auto): Automatically selects the appropriate measurement range. 

* Data Hold function: freezes the display for easier reading. 

* Low Battery Indication: Warns you when the battery is low. 

* Backlight: Improves visibility in low light conditions, for reading measurement results. 


Overall, the ANENG AN9002 is a versatile and convenient digital multimeter that is well suited for a wide range of electrical and electronic applications. Its Bluetooth connectivity and advanced features make it a valuable tool for professionals and hobbyists


Saturday, October 21, 2023

Website Domain Address and Adsense txt


Some time ago my Adsense account displayed the following message.


Earnings at risk - You need to fix some ads.txt issues to avoid severe impact to your revenue.

ADS, which stands for Authorized Digital Sellers, is an initiative of the Interactive Advertising Bureau (IAB) Tech Lab to increase transparency in programmatic advertising. This allows publishers to identify who is authorized to sell their inventory. This is a small document (ads.txt) where the adsense account number is written, and it is embedded in the domain.

It turns out that the problem with ads.txt occurred because there was a problem with accessing the domain address.

Before fixing the settings, my site could only be accessed with the address:

https://www.atsunday.com


Meanwhile, if you use another address format it will not be found by search engines, such as:

Without secure address:

Http://www.atsunday.com

Domain addresses without World Wide Web (WWW) or also known as naked addresses cannot be accessed:

https://atsunday.com


It has been set so that those addresses connect to each other but it doesn't work.

It turns out there is a trick to setting it.


As suggested on the blogger help community:


I focus on doing steps 1 to 10 which are relevant for my site.

1. go to your https://www.blogger.com dashboard

2.  open Settings tab

3.  Make sure that "Redirect domain" is enabled

4. scroll down to "HTTPS"

5. disable "HTTPS availability"

6. wait 5 minutes and refresh the Settings tab

7. enable "HTTPS availability" again

8. wait 15-60 minutes* and refresh the Settings tab

9. enable "HTTPS redirect" if the status is "Available / OK"

10. then: clear the cache in your browser.

* Your SSL certificate will not be generated immediately, that's why you have to wait.

With "Redirect domain" and"HTTPS redirect" enabled, all links will be redirected to https://www....

After carrying out these steps, wait about 30 minutes. While waiting your site is not active, so it is not read by search engines. Then the display in Blogger Settings will appear as follows.


Your site will be active again, and read by search robots.

I finished setting it up around 11 am. The next morning around 6 o'clock, the status on AdSense changed.


As the above picture, it can be seen that the ads.txt status has been found, and the status is Authorized. Previously the status was Not Found.


Thursday, September 21, 2023

Alamat Domain Website dan Adsense txt


Beberapa waktu lalu akun adsense saya menampilkan pesan berikut.


Earnings at risk - You need to fix some ads.txt issues to avoid severe impact to your revenue.

Penghasilan berisiko - Anda perlu memperbaiki beberapa masalah ads.txt untuk menghindari dampak buruk terhadap pendapatan Anda.

ADS adalah singkatan dari Authorised Digital Sellers, adalah inisiatif dari Interactive Advertising Bureau (IAB) Tech Lab untuk meningkatkan transparansi dalam periklanan terprogram. Sehingga memungkinkan penerbit mengidentifikasi siapa yang berwenang untuk menjual inventaris mereka. Ini adalah sebuah dokumen kecil (ads.txt) di mana tertulis nomor akun adsense, dan disematkan pada domain.

Ternyata masalah pada ads.txt terjadi karena ada masalah pada akses alamat domain.

Sebelum diperbaiki setelannya, situs saya hanya dapat diakses dengan alamat:

Https://www.atsunday.com


Sedangkan jika menggunakan format alamat lain tidak akan ditemukan oleh mesin pencari, seperti:

Tanpa secure address:

Http://www.atsunday.com


Alamat domain tanpa World Wide Web (WWW) atau disebut juga naked address juga tidak bisa diakses:

Https://atsunday.com


Sudah sempat disetel agar alamat tersebut terhubung satu sama lain tapi tidak berfungsi.

Ternyata ada trik untuk menyetelnya.

Sebagaimana disarankan pada komunitas bantuan blogger:


Saya fokus melakukan langkah 1 sampai 10 saja. Sedangkan langkah di atasnya tidak relevan untuk situs saya.

pengaturan:

1. buka dasbor https://www.blogger.com Anda

2. buka tab Pengaturan

3. Pastikan "Pengalihan domain" diaktifkan

4. gulir ke bawah ke "HTTPS"

5. nonaktifkan "ketersediaan HTTPS"

6. tunggu 5 menit dan segarkan tab Pengaturan (setting)

7. aktifkan "ketersediaan HTTPS" lagi

8. tunggu 15-60 menit, dan segarkan tab Pengaturan

9. aktifkan "HTTPS redirect" jika statusnya "Available/OK"

10. lalu bersihkan cache (data sementara) di browser Anda.


Setelah melakukan langkah-langkah tersebut, tunggu sekitar 30 menit. Saat menunggu situs Anda tidak aktif, sehingga tidak terbaca oleh mesin pencari. Maka kemudian tampilan pada blogger setting akan tampak sebagaimana berikut.


Situs Anda akan aktif kembali, dan terbaca oleh robot pencari.

Penyetelan selesai saya lakuksn sekitar jam 11 siang. Keesokan paginya sekitar jam 6, status pada adsense berubah.


Terlihat status ads.txt sudah ditemukan dan statusnya menjadi Authorised. Sebelumnya status tersebut adalah Not Found.


Wednesday, December 11, 2019

Digital Acoustic Tachometer Android Application Tool


This Android application can measure revolutions per minute (RPM tachometer, RPM tach) by listening to the engine sound, so it can be classified as a non contact tachometer. It can be downloaded on Google Play with the name Acoustic Tachometer (RPM) made by Javier Yáñez. On Samsung smartphones the size is around 11.17 megabytes. Currently the application is free of charge.


As can be seen on YouTube video above, the application is tested with the car door open. It turns out the results are less accurate, especially when engine in stationary.

Also read how to connect the tachometer wiring.

With the door closed, the window closed, the measurement results are more accurate. And of course there is no music in the cabin. Looks like this application detects the sound of engine boom when power stroke. A quiet cabin makes it easy for this application to detect that engine power stroke sound.

When tested on the engine hood (bonnet), the application cannot measure accurately. Possibly because too much mechanical noises. The application cannot detect the thumping sound from the combustion process. Mechanical sounds can come from valves, bearings, fans, V belt, vibrating plates, and others.

More details about the tachometer function on the vehicle.

Inside the cabin the mechanical noise is muted by sound absorbers. While the sound of power stroke is weaker, but it is still clearly heard and roaring.

When it is tested close to exhaust outlet, the application cannot measure accurately. Possibly because the muffler is the silent type.

The menu in the application is quite easy, simple yet functional. Settings that are often adjusted:
  • engine cycle type (2 stroke, 4 stroke)
  • number of cylinders, usually 1 for motorbike and 4 for car
As seen at the end of video. The application is tested on motorbike, smartphone must be brought close to the exhaust outlet so that measurement becomes more accurate. Possibly because the environment is open, and the mechanical sounds are very noisy. So the application becomes confused by too much sounds that are caught by the microphone.

Thursday, December 5, 2019

Digital Akustik Tachometer Alat Aplikasi Android


Aplikasi Android ini dapat mengukur putaran per menit (Revolution Per Minute tachometer, RPM tach) dengan mendengarkan suara engine, sehingga dapat digolongkan sebagai non contact tachometer. Dapat diunduh di Google Play. dengan nama Acoustic Tachometer (RPM) yang dibuat oleh Javier Yáñez. Pada Samsung smartphone besarnya sekitar 11.17 megabyte. Saat ini aplikasi ini gratis.


Ditest dengan pintu mobil terbuka, ternyata hasilnya kurang akurat, sebagaimana tampak pada video YouTube di atas. Terutama pada putaran stasioner (langsam).

Baca juga cara menyambung kabel tachometer.

Dengan pintu tertutup, jendela tertutup, hasil pengukuran lebih akurat. Dan tentu saja tidak ada suara musik di dalam kabin. Sepertinya aplikasi ini mendeteksi suara dentuman engine saat pembakaran terjadi (power stroke). Kabin yang tenang akan memudahkan aplikasi untuk mendeteksi suara engine.

Saat dicoba diletakkan di atas kap depan, aplikasi tidak bisa mengukur dengan akurat. Kemungkinan karena suara mekanikal mengganggu aplikasi sehingga tidak dapat mendeteksi suara dentuman dari proses pembakaran. Suara mekanikal bisa berasal dari klep (valve), bantalan (bearing), kipas (fan), sabuk V (V belt), pelat yang bergetar, dan lain-lain.

Lebih detail tentang fungsi tachometer pada kendaraan.

Di dalam kabin suara mekanikal diredam oleh peredam suara. Sedangkan suara dentuman pembakaran walaupun lebih lemah, tapi masih terdengar jelas seperti suara derum.

Saat dicoba dengan mendekatkan ke lubang knalpot, aplikasi tidak bisa mengukur dengan akurat. Kemungkinan karena knalpot tersebut dari tipe senyap.

Menu pada aplikasi cukup mudah, sederhana namun fungsional. Setelan yang sering disesuaikan adalah:

  • tipe siklus engine (2 stroke, 4 stroke)
  • jumlah silinder, biasanya 1 untuk sepeda motor dan 4 untuk mobil.


Pada sepeda motor, smartphone harus didekatkan ke knalpot agar pengukuran lebih akurat. Mungkin karena lingkungan yang terbuka, dan suara mekanikal cukup kuat, sehingga aplikasi menjadi bingung dengan banyaknya suara yang tertangkap microphone.


Saturday, November 2, 2019

How Excel Formula Calculate Degrees of Angle


Microsoft Excel uses radians as a unit of measurement of angle or degree.

1 (one) radians is equal to 57.29577951 degrees or rounded to 57.296.

1 (one) radians is equal to 180 degrees divided by Pi (22/7).

Read also calculate land lot area by GPS (Global Positioning System) coordinates which uses trigonometric formulas.

Therefore the measurement in degrees must be converted into radians for accurate calculation results. Following are the sine, cosine, and tangent formulas:

sine of 90 degrees
=SIN(90/57.296)
the result is 1

cosine 90 degrees
=COS(90/57.296)
the result is 6E-06 or rounded to 0

tangent 45 degrees
=TAN(45/57.296)
the result is 0.999993955 or rounded to 1.


The formula on the above examples are already syntactically correct or correct writing format, so that it can be copied and pasted on an Excel sheet, as shown below.


Also read the VLOOKUP function in Excel with examples of applications in: list of names, phone, warehouse stock (inventory), and others.


Changes from degrees to radians can be done by the RADIANS formula.
example of changing 90 degrees to radians:

=RADIANS(90)
the result is 1.570796327


And to convert radians to degrees can use the DEGREES formula.

=DEGREES(1.570796327)
the result is 90


Read also RANK formula which can be applied for sports competition.


For the inverse formula of the above function or arc are as follows:

arcsinus 0.5
=ASIN(0.5)
the result is 0.523598776 radians


to get directly into unit of degrees the formula is
=DEGREES(ASIN(0.5))
the result is 30 degrees

arccosinus 0.5
=ACOS(0.5)
the result is 1.047197551 radians

to go directly to units of degrees the formula is
=DEGREES(ACOS(0.5))
the result is 60 degrees


arctangen 0.5
=ATAN(0.5)
the result is 0.463647609 radians

to get directly to units of degree the formula is
=DEGREES(ATAN(0.5))
the result is 26.56505118 degrees


The ATAN formula can be used to calculate the angle of the house roof.


Thursday, October 3, 2019

Cara Rumus Excel Menghitung Sudut Derajat


Microsoft Excel menggunakan radian sebagai satuan pengukuran sudut atau derajat.

1 (satu) radian sama dengan 57.29577951 derajat atau dibulatkan menjadi 57,296 saja.

1 (satu) radian sama dengan 180 derajat dibagi Pi (22/7).

Baca juga pengukur tanah dengan GPS (Global Positioning System) yang menggunakan rumus trigonometri.

Maka pengukuran dengan satuan derajat harus dirubah terlebih dahulu ke radian agar hasil perhitungannya akurat. Berikut ini adalah rumus sinus, cosinus, dan tangen:

sinus 90 derajat
=SIN(90/57.296)
hasilnya 1

cosinus 90 derajat
=COS(90/57.296)
hasilnya 6E-06 atau dibulatkan jadi 0

tangen 45 derajat
=TAN(45/57.296)
hasilnya 0.999993955 atau dibulatkan menjadi 1.

Rumus pada contoh sudah sesuai sintaksis (syntax) atau format penulisan, sehingga dapat di copy-paste pada lembar Excel, sebagaimana gambar di bawah.


Baca juga fungsi VLOOKUP pada Excel dengan contoh penerapan pada: daftar nama, telpon, stock barang di gudang (inventori), dan lain-lain.

Perubahan dari derajat ke radian dapat dilakukan dengan rumus RADIANS.
contoh merubah 90 derajat menjadi radian:
=RADIANS(90)
hasilnya 1.570796327

Sebaliknya untuk merubah radian menjadi derajat dapat menggunakan rumus DEGREES.
=DEGREES(1.570796327)
hasilnya 90

Baca juga rumus RANK yang dapat diaplikasikan untuk kompetisi olahraga.

Untuk rumus inversi (kebalikan) fungsi di atas atau arc adalah sebagaimana berikut:

arcsinus 0,5
=ASIN(0.5)
hasilnya 0.523598776 radian
untuk langsung ke satuan derajat maka rumusnya adalah
=DEGREES(ASIN(0.5))
hasilnya 30 derajat

arccosinus 0,5
=ACOS(0.5)
hasilnya 1.047197551 radian
untuk langsung ke satuan derajat maka rumusnya adalah
=DEGREES(ACOS(0.5))
hasilnya 60 derajat

arctangen 0.5
=ATAN(0.5)
hasilnya 0.463647609 radian
untuk langsung ke satuan derajat maka rumusnya adalah
=DEGREES(ATAN(0.5))
hasilnya 26.56505118 derajat

Rumus ATAN dapat digunakan untuk menghitung sudut kemiringan atap rumah.


Tuesday, January 23, 2018

VLC Media Player Records Desktop Screen Activity


VLC Media Player can be used to record screen activity on your computer. As shown in below video


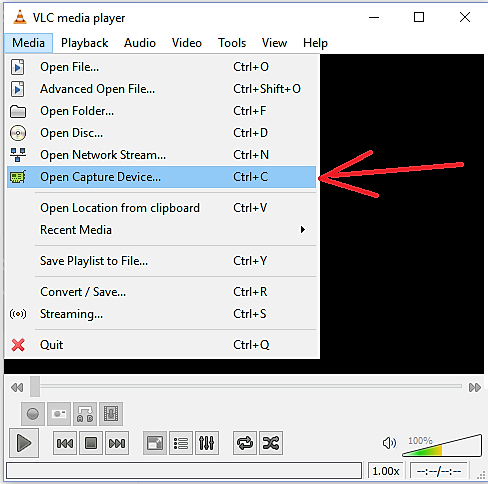
Open the VLC Media Player program, in the Media menu click Open Capture Device, as shown below.


In the Open Media menu select Capture mode Desktop.


Desired frame rate for the capture is the number of frames recorded per second. Set to record 10.00 f/s or 10 frames per second. This setting is usually good enough and does not make the computer too busy and slow the computer performance.

At the bottom right button, select Convert to change the on-screen activity into a video recording.

The Convert menu will appear as shown below.


Browse the folder to save the video and name it, in the example above the video is named screen.ps.

Click the Start button and VLC will record all the activities on your screen. The video will be saved in PS format, which is very small and can be played by VLC. Furthermore the PS video format can be converted by VLC to MP4.


To stop recording screen activity, click Stop playback button as shown above.

Saturday, January 13, 2018

VLC Media Player Merekam Aktivitas Layar Desktop


VLC Media Player dapat digunakan untuk merekam aktivitas layar di komputer anda. Sebagaimana video berikut:


Buka program VLC Media Player, pada menu Media klik Open Capture Device, sebagaimana gambar di bawah.


Pada menu Open Mediam pilih Capture mode Desktop.


Desired frame rate for the capture adalah jumlah bingkai per detik yang rekam. Disetel untuk merekam 10.00 f/s atau 10 bingkai per detik, Karena biasanya videonya sudah cukup baik dan tidak membuat komputer terlalu sibuk sehingga memperlambat kinerja komputer.

Pada tombol paling bawah kanan, pilih Convert agar merubah aktifitas yang pada layar menjadi rekaman video.

Menu Convert akan muncul sebagaimana gambar di bawah.


Browse folder untuk menyimpan video dan beri nama video tersebut, di contoh atas video diberi nama screen record.ps.

Klik tombol Start dan VLC akan merekam semua kegiatan pada layar anda. Video akan tersimpan dengan format PS, yang berukuran sangat kecil dan dapat dimainkan oleh VLC. Selanjutnya video format PS dapat dikonversi oleh VLC menjadi MP4.


Untuk berhenti merekam aktifitas layar, tekan tombol Stop playback sebagaimana gambar di atas.


Tuesday, August 9, 2016

My Amazon Kindle Books

My Amazon shop Kindle format epub books. Some of these homemade books are using unused plastic sheet, polystyrene, rubber ban, drinking straw, ice cream stick, etc. to make science toys. Hopefully those books will help to reduce redundant household materials, promote plastic recycle at home, could become precious plastic products, and reduce plastic pollution.

These interesting science toy projects are guaranteed can be done at home. They will make you excited and wake up easily at Sunday morning.

Origami project with plastic sheet to make baking powder submarine


Plastic drinking straws electric boat and submarine


Homemade polystyrene boat or ship and plastic torpedo toys powered by Marangoni effect (different surface tension) 


Do it yourself wooden laser pistol and laser pointer, using laser beam for dry shooting practice.


Marangoni effect (different surface tension) power moves polystyrene toy boat or ship.


Wednesday, December 18, 2013

Liquid Volume In Complicated Horizontal Cross Section Tank


Some audiences asked about how to calculate liquid volume in a horizontal tank which have a complex cross section like a tank on tanker truck, tank which has cross section shaped like a rectangle but with smaller top smaller, curved cross section of all sides, and rounded all corners, like the one on photo.


If the horizontal cross section of the tank is uniform (homogeneous) for the whole length of tank, then the volume of liquid in the tank is calculated by: liquid covered cross-sectional area multiplied by length of tank.

The question is how to calculate the cross-sectional area which is covered by liquid ??

In my opinion, the easiest way is to photograph the tank cross section, and put the photo onto graph paper. The more boxes on that graph paper the more accurate calculation results, see figure below. You can make graph paper using Excel sheet, and put tank cross section photo on to it, like I did.


When taking the picture, the camera position must be perpendicular to the cross section of tank and camera aims right around the midpoint of tank cross section. It is better to photograph the tank from a distance, and use telephoto or zoom function on the camera to make tank looks bigger.

If the photo is taken from a short distance, and the tank for example in a higher position of the camera, then the camera will seeing up. It will make the bottom of the tank appear larger than actual, and the top of tank will look smaller than it really is.

Liquid level in the tank can be measured using a dipstick (measuring stick). The measurement results are described on to a graph paper in order to obtain x and y coordinates. More coordinates (x, y), or more boxes on the graph paper, means more accurate calculation result.

For curved line of polygon, more coordinates means more fine the arch so that more accurate calculation result. For a straight line like the one representing liquid surface, then only 2 point coordinates are needed, because mathematically a straight line is a line connecting two points.

To calculate the cross sectional area of ​​the tank, can be done with an irregular polygon area calculation. Please read polygon area article.

Download Excel program here, to calculate the area of ​​polygon of tank cross section. After you get coordinates from graph paper, then input those coordinates in to the Excel sheet containing the program. Below is a simple example of Excel program that automatically calculates polygon area with certain coordinates.


See the above example of a simple calculation, polygon cross-sectional area of ​​the tank can be read in the column 'Area' and in the row 'Total', the number is 12.0.

A straight line at top of polygon is representing liquid surface inside the tank. The surface height was measured by dipstick, as the above example: liquid surface height is 3 units of measurement.

Based on scale system, if each number representing the x and y coordinate with distance of 20 cm, the calculated area by the program must be multiplied by 400 or = 20x20, in order to obtain area units of measurement square centimeters (cm2). If each x and y number represents 1 cm, then calculation result will be square centimeters (cm2), no need to multiplication.

Data row on the Excel program can be added by 'Copy - Insert Copied Cells' function, so the more the coordinates can be calculated and calculation result will be more accurate.

As we can obtain the cross-sectional area of ​​the tank that is covered by liquid, then cross-sectional area multiplied by the length of the tank will become the volume of liquid in the tank.

Accuracy of calculation will also depend to the thickness of tank plate, tank level position, and others.


Sunday, November 17, 2013

Volume Cairan Di Tanki Horizontal Berpenampang Rumit


Beberapa pemirsa menanyakan tentang volume cairan di dalam tanki horisontal yang berpenampang rumit seperti pada truk tanki, di mana penampang tanki berbentuk mirip segiempat tapi dengan bagian atas mengecil, semua sisi penampang melengkung, demikian juga semua sudutnya membulat, harap lihat foto.


Jika penampang tanki horizontal tersebut seragam (homogen) untuk setiap panjang tanki, maka volume cairan di dalam tanki adalah luas penampang yang tertutup oleh cairan dikalikan panjang tanki.

Pertanyaannya adalah bagaimana caranya menghitung luas penampang yang terendam cairan??

Menurut saya cara termudah adalah memfoto penampang tanki, lalu foto tersebut dipasangkan pada lembaran koordinat atau kertas kotak. Semakin banyak kotak-kotak koordinat maka semakin akurat hasil perhitungan, lihat gambar di bawah.


Perlu diperhatikan saat mengambil foto, posisi kamera harus benar-benar tegak lurus terhadap penampang tanki dan kamera dibidik tepat di sekitar titik tengah penampang tanki. Agar memudahkan maka tanki difoto dari jarak yang agak jauh, lalu diperdekat dengan fungsi zoom atau tele pada kamera.

Jika foto diambil dari jarak dekat, sedangkan tanki misalnya dalam posisi yang lebih tinggi dari kamera, maka kamera akan menengadah (melihat ke atas) sehingga bagian bawah tanki akan tampak lebih besar dari sebenarnya, dan bagian atas tanki akan tampak lebih kecil dari sebenarnya.

Tinggi cairan di dalam tanki dapat diukur dengan menggunakan dipstick (tongkat ukur). Hasil pengukuran digambarkan di lembar koordinat agar didapat angka koordinat x dan y. Semakin banyak koordinat (x,y) maka semakin akurat hasil perhitungan.

Untuk bagian yang melengkung semakin banyak koordinat yang diinput maka akan semakin halus lengkungan sehingga semakin akurat hasil kalkulasi. Untuk garis lurus seperti pada permukaan cairan, maka cukup 2 titik koordinat yang diinput, karena secara matematika suatu garis lurus adalah garis yang menghubungkan 2 buah titik.

Untuk menghitung luas penampang tanki, dapat dilakukan dengan perhitungan luas poligon tak beraturan. Baca artikel luas poligon.

Unduh program Excel disini, untuk menghitung luas poligon penampang tanki. Lalu masukkan koordinat yang didapat dari kertas kotak ke lembar Excel yang mengandung program. Di bawah ini adalah contoh sederhana dari tampilan di program Excel yang menghitung secara otomatis luas poligon yang telah diketik koordinatnya.


Lihat gambaran perhitungan poligon sederhana diatas, luas area poligon penampang tanki dapat dibaca pada kolom Area di baris Total, yaitu 12.0.

Bagian atas poligon tampak garis lurus mendatar yang menggambarkan permukaan cairan di dalam tanki. Tinggi permukaan cairan ini diukur dengan tongkat ukur. Pada contoh diatas tinggi permukaan cairan adalah 3 satuan ukur.

Berdasarkan sistem skala, jika setiap angka koordinat x dan y mewakili 20 cm, maka luas yang dihitung oleh program harus dikalikan 400 atau =20x20, agar didapat luas dalam satuan centimeter persegi (cm2). Jika setiap angka pada koordinat mewakili 1 cm, maka hasil perhitungan program akan sama dengan luas dalam satuan centimeter persegi (cm2), tidak perlu perkalian lagi.

Baris data pada program Excel tersebut dapat ditambah dengan cara Copy-Insert Copied Cells, agar semakin banyak koordinat yang dapat dihitung sehingga hasil perhitungan akan semakin akurat.

Jika luas penampang tanki yang terendam cairan sudah didapat. Maka luas penampang tersebut dikalikan panjang tanki akan menghasilkan volume cairan di dalam tanki.

Akurasi perhitungan juga akan bergantung pada ketebalan pelat tanki, posisi level (rata air) tanki, dan lain-lain.

Wednesday, May 1, 2013

Learning Rank Formula For Sports Competition


Sports competitions need to calculate standings points in order to determine the ranking of winner. In the attached Excel sheet there is a formula for RANK.

And it is also using VLOOKUP formula to display each participant at each rank.

In the full or half competition system, standings calculated by points, which are:

Win gets 3 points

Draw gets 1 point

Lose gets 0 point

If any of participants get the same points, the participant with the highest total score entitled to a higher rank. For example on football or futsal competitions, Barcol and Ajaks get the same 14 points, then their score will   determines the winner. On football or futsal score is the number of goals scored.


Look at the picture above. To apply that rules, the Excel program has a factor that is 10000, seen on the right side of the big table. This figure is used to divide the score number, and the results is summed to point. So that there will be a slight difference between those clubs with the same points. So the program can determine the ranking for Barcol (14.0008) and Ajaks (14.0001).

Number 10000 is choosen as it is big enough so that if the score is divided by 10000 will not make a huge difference in points but different enough for the program to determine the difference in rankings. As seen on POINT column, Barcol gets 14 points. As Barcol has 8 score, which is divided by 10000, then added to 14 and become 14.0008. Decimal number 0.0008 is sufficient to let the program decides that Barcol has higher ranking than Ajaks.

If using a small number like 10 as the factor. When a participant get 15 score 15 like in badminton. So 15 divided by 10 is 1.5, it would rise point to 1.5, it certainly does not fit the rules of the competition.

That FACTOR calculation may become confusing for some participants. So that is why it has grey font format. That column can be hidden to avoid misunderstanding.

RANK in the leftmost column automatically calculate the ranking of any participant or club. It is using RANK formula to check data in FACTOR column.


Seen on Function Arguments, as shown above, the RANK formula is very simple. Number is a cell that contains a certain number of data (Ref), formula will rank that Number of that Ref data. In the above picture, Number is cell I8, while Ref is cells I8 to I15 or FACTOR column. $ character in Ref is used to lock formula to see only (refer only) to row 8 to row 15, when formula is copied. Order is rank order, if typed 0 then the highest Number will be the winner, or descendant. Conversely, if typed other than 0, then rank order will be ascendant, the lowest Number will be the winner.

The small table on the right displays the rank ordered from smallest number (winner) to the largest number (most to lose). This table uses VLOOKUP formula. The formula will look for the participant ranking according to the ranking that is written in the RANK column in the WINNER table.

Tables can be modified in order to accommodate more participants by Copy-Paste Insert Cells on the row that contains the formula. Blue colored cells are containing formula.

Tuesday, April 30, 2013

Belajar Rumus Rank Untuk Kompetisi Olahraga


Kompetisi olahraga membutuhkan klasemen untuk menghitung poin agar dapat menentukan rangking pemenangnya. Pada lembar Excel terlampir terdapat rumus RANK untuk menentukan peringkat.

Dan juga terdapat rumus  VLOOKUP untuk menampilkan masing-masing peserta pada setiap peringkatnya.


Pada sistem kompetisi penuh dan setengah kompetisi, klasemen atau stand dihitung dengan cara :

Menang mendapat 3 poin

Seri mendapat 1 poin

Kalah mendapat 0 poin

Jika ada peserta yang mendapat poin sama, maka peserta dengan jumlah skor terbanyak berhak mendapat klasemen lebih tinggi. Misal pada kompetisi sepak bola atau futsal, klub Ajaks dan Barcol mendapat poin yang sama yaitu 14, maka skor yang menentukan pemenangnya. Pada sepakbola atau futsal skor adalah jumlah goal yang berhasil dicetak.


Lihat pada gambar tampilan Excel diatas. Untuk menerapkan aturan tersebut, maka pada program Excel ini ditetapkan suatu angka Factor yaitu 10000, terlihat pada bagian kanan tabel besar. Angka ini berguna untuk membagi nilai skor (SCORE), dan hasil pembagian dijumlahkan dengan poin (POINT). Sehingga akan terdapat perbedaan pada club dengan poin yang sama. Sehingga program dapat mengetahui adanya perbedaan untuk menentukan ranking kepada klub Ajaks (14.0001) dan Barcol (14.0008).

Angka 10000 dipilih karena cukup besar sehingga jika skor dibagi angka 10000 tersebut tidak akan membuat perbedaan besar pada poin tapi cukup berbeda bagi program untuk menentukan perbedaan peringkat. Terlihat pada poin tabel, Barcol mendapat poin 14. Poin Barcol ditambah dengan skor 8 yang dibagi 10000 menjadi 14.0008. Angka desimal 0.0008 sudah cukup untuk program mengetahui bahwa Barcol lebih tinggi peringkatnya dari Ajaks.

Jika menggunakan angka kecil seperti 10 sebagai faktor pembagi skor. Jika jumlah skor adalah mencapai 15 seperti pada bulutangkis. Maka 15 dibagi 10 adalah 1.5, yang mana akan merubah nilai poin menjadi naik 1.5, hal ini tentu saja tidak sesuai aturan kompetisi.

Kolom FACTOR mungkin dapat membingungkan peserta. Karena itulah hurufnya diberi warna abu-abu. Kolom ini dapat disembunyikan (hide) agar mencegah salah paham.

Kolom RANK di paling kiri menghitung secara otomatis ranking atau peringkat dari setiap peserta atau club. Kolom WIN adalah jumlah kemenangan yang diraih peserta. DRAW adalah jumlah seri. LOSE adalah jumlah kekalahan.


Terlihat pada jendela Function Arguments sebagaimana gambar diatas, rumus RANK sangat sederhana. Number pada rumus tersebut adalah nomor yang akan dicarikan peringkatnya dari suatu data yaitu Ref. Pada gambar diatas Number adalah sel I8, dan Ref adalah data pada sel I8 sampai I15 atau kolom FACTOR. Tanda $ pada Ref berguna jika rumus dicopy-paste, tanda $ akan mengunci rumus agar hanya melihat (mereferensi) pada baris 8 sampai 15. Order adalah aturan peringkat, jika diketik 0 (nol) pada Order maka peringkat pertama (pemenang 1) akan diberikan pada Number dengan nilai tertinggi. Sebaliknya, jika pada Order diketik angka selain 0 maka peringkat pertama akan diberikan pada Number dengan nilai terendah.

Pada tabel kecil di kanan menampilkan peringkat yang diketik dan diurut dari paling kecil (pemenang) sampai paling besar (paling kalah, juru kunci). Tabel ini menggunakan rumus VLOOKUP. Rumus tersebut akan mencari club yang rangkingnya sesuai dengan rangking yang tertulis pada kolom RANK di tabel WINNER.

Tabel tersebut dapat dimodifikasi agar dapat menampung peserta yang lebih banyak dengan cara Copy -Insert Paste Cells pada baris yang mengandung rumus. Sel-sel yang berwarna biru mengandung rumus.

Wednesday, March 20, 2013

Kalkulasi Koordinat GPS Berdasar Data Heading & Jarak


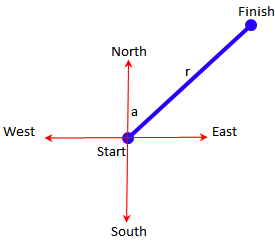
Melanjuti artikel 'Menghitung Sudut Heading Atau Bearing Dari Koordinat GPS', pada artikel ini dibahas mengenai cara menghitung koordinat GPS dari titik tujuan, jika koordinat GPS di titik awal, heading, dan jarak tempuh diketahui. Untuk lebih jelasnya harap lihat gambar di bawah.


a adalah sudut heading, dimana titik 0 derajat adalah arah ke utara peta, 90 derajat adalah arah timur peta, 180 derajat adalah arah selatan peta, 270 derajat adalah arah barat peta, dan 360 derajat sama dengan 0 derajat atau arah utara peta.

r adalah jarak dari start ke finish.

Jika titik awal atau start diketahui, maka titik akhir atau finish dapat dihitung.

Dokumen Excel yang berisi rumus-rumus yang akan menghitung secara otomatis dapat di download di sini.

Mohon diperhatikan bahwa koordinat bujur (longitude) dan lintang (latitude) jangan sampai terbalik. Google Maps menggunakan sistem lintang dan bujur (y dan x), bukan sebagaimana biasanya pada matematika bujur dan lintang (x dan y). Program Excel menggunakan sistem desimal Amerika dimana desimal ditandai dengan titik bukan koma. Sedangkan ribuan ditandai dengan koma, bukan titik.

Heading tidak selalu sama saat start dan saat finish, terutama untuk jarak jauh. Jika kita berada disekitar khatulistiwa atau equator, heading awal dan akhir bisa hampir sama. Hal ini karena posisi kita terhadap kutub utara maupun Selatan selalu hampir sama. Misal suatu penerbangan dilakukan sepanjang garis khatulistiwa ke arah timur (heading 90 derajat). Maka selama pesawat tersebut berada di garis khatulistiwa dan mengarah ke timur, dimanapun posisinya, kutub utara selalu di sebelah kiri, dan kutub Selatan selalu di sebelah kanan pesawat.

Tapi jika perjalanan dilakukan melalui kutub, misalnya kutub utara, saat awal perjalanan heading 0 atau 360 derajat. Ketika melewati titik kutub utara (90,0), maka heading akan berubah menjadi 180 derajat. Walau perjalanan mengikuti garis lurus, tidak berbelok.

Misalnya: penerbangan dari Pulkovo International Airport, Saint Petersburg, Russia (59.800278, 30.262500). Setelah lepas landas dari Saint Petersburg, Rusia; initial heading ke arah 0.147 atau ke utara. Penerbangan ini menempuh jarak 6,570.679 km. Jika data titik awal, initial heading, dan jarak diinput pada lembar ‘end & midpoint’. Maka hasil kalkulasinya adalah penerbangan ini menuju titik (61.17417, -149.99833) yaitu Ted Stevens Anchorage International Airport, Alaska, United States of America. Pada saat akan mendarat maka arah berubah menjadi 179.844 derajat atau ke Selatan (final heading). Walau sebenarnya penerbangan yang dilakukan bergerak di jalur lurus, tidak berbelok agar menempuh jarak tersingkat.

Maka untuk memperjelas jalur yang dilalui, dikalkulasi juga Mid point, yaitu titik di pertengahan perjalanan adalah (89.309101, 36.265637). Arah penerbangan di titik tengah ini adalah 6.130 derajat.

Contoh untuk daerah dekat kutub selatan: jika anda terbang dari Wellington International Airport, Wellington New Zealand (-41.326698, 174.806857). Setelah tinggal landas pesawat akan mengarah ke 134.528 atau sekitar tenggara. Penerbangan akan melintasi jarak 8,569.730 km, dan akan tiba di titik akhir (-41.438512, -73.094015) El Tepual International Airport, Puerto Montt, Los Lagos, Chile. Final heading sebelum mendarat adalah 45.586 derajat. Atau mengarah sekitar timur laut. Titik tengah penerbangan ini adalah di (-57.631250, -129.216744) mendekati kutub selatan, heading pada titik tengah adalah 90.126 derajat atau mengarah ke timur.

Contoh untuk khatulistiwa: Penerbangan dari bandara Supadio (-0.14735, 109.402585), Pontianak, Kalimantan Barat, Indonesia. Setelah lepas landas menuju ke arah 91.920 derajat atau ke timur. Setelah menempuh perjalanan sejauh 19,173.059 km, akan tiba di titik (-0.113333, -78.358611) yaitu Mariscal Sucre International Airport, Tababela, Quito Metro, Ecuador. Final heading adalah 88.078 derajat atau ke timur.

Mid point penerbangan khatulistiwa ini adalah titik (-1.925201, -164.477443) dekat pulau Jarvis, dan heading 89.983 derajat atau ke timur. Jadi untuk jalur sepanjang khatulistiwa, heading hampir selalu konstan sekitar 90 derajat.

Gambar di bawah adalah bola dunia yang dihampar menjadi dua dimensi atau datar, menunjukkan bahwa garis lintang (biru) selalu sejajar dengan garis khatulistiwa (merah, latitude 0). Arah kompas kutub utara-selatan absolut (bukan kutub magnetik bumi) selalu mengikuti garis bujur (hitam) yang tampak melengkung dan tidak tegak lurus terhadap lintang. Pada bola dunia yang bulat, garis bujur selalu tegak lurus terhadap garis lintang.


Sebuah pesawat terbang dari Dubai International Airport, Garhoud, Dubai (United Arab Emirates) (25.253192, 55.365751). Pesawat tersebut menuju Tokyo Haneda Airport, Ōta, Tokyo (Japan) (35.549489, 139.779957). Terlihat pada gambar Google maps di bawah.


Dari khatulistiwa tampak penerbangan tersebut mengikuti garis melengkung, padahal sebenarnya itu adalah garis lurus dengan jarak terpendek yang mengikuti lengkungan bumi.

Maka akan terbaca pada kompas di pesawat terbang: initial heading dari penerbangan Dubai ke Tokyo adalah 58.714 derajat, heading pada mid point berubah menjadi 108.493 derajat, dan pada titik akhir dekat Tokyo adalah 80.258 derajat. Walau secara aktual pesawat tersebut terbang lurus pada jalur terpendek, mengikuti lengkung bola bumi.

Radius bumi yang digunakan adalah 6,378.14 km yaitu radius bumi pada khatulistiwa. Nilai radius bumi dapat disesuaikan agar lebih akurat karena bumi tidak bundar sempurna. Jika menggunakan nilai rata-rata radius bumi yaitu 6371 km. Sedangkan radius pada kutub bumi sebesar 6,356.7523 km.

Baca juga menghitung luas tanah dengan koordinat GPS.

Jika menggunakan Google Maps, maka hasil perhitungan atau titik finish dapat copy lalu paste pada Search box di Google Maps, lalu tekan tombol Search. Google Maps akan menunjukkan titik yang dimaksud pada peta.


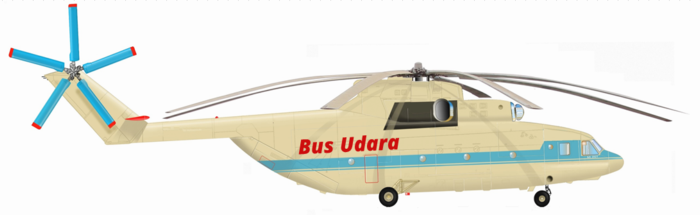
Bus Udara Transportasi Masa Depan saran solusi transportasi Jakarta, Bogor, Depok, Bekasi, Tanggerang, yang cepat, bebas macet dan banjir. Helikopter Mil Mi 26 daya angkut 90 penumpang membuat ongkos ticketnya jadi terjangkau. Estimasi Rp 200.000 Bogor-Jakarta, Rp 100.000 Depok-Jakarta.

Monday, December 10, 2012

Calculating Heading Or Bearing Angle Of GPS Coordinates


Heading is the direction you are walking or driving a vehicle or flying, it is using units of degrees with the north as a point of 0 or 360 degrees. East is 90 degrees, south is 180 degrees, and west as 270 degrees. North may use the magnetic north (compass), but can also use an absolute north (North Pole).


In this attached excel sheet, I use the absolute north as a point of north or 0 degree.


Suppose you are walking from point A to point C, or from starting point to a camp as the above picture, through point B or a bridge at north. Start at point A, you move to the north to point B, or the so-called heading 0 degree, as far as 10 km. Arriving at point B, you turn to the right, or the so-called 90-degrees heading and walk towards point C with 10 km distance. Bearing is the angle of the starting point towards the end of the journey or the destination point, or position of an object from the observer. So a bearing, can be composed of several headings. In the example above, bearing from point A to point C is 45 degrees. Bearing is also called azimuth.

GPS coordinate system used on the Excel sheet is a decimal number, because it is more easily calculated. On ‘conversion’ sheet, there are formulas to change decimal number to sexagesimal (degrees minutes seconds).

Please note the sequence of latitude and longitude coordinate, not to reverse. Google Maps uses a system of latitude and longitude (y and x), instead of as usual in mathematics longitude and latitude (x and y).

Heading when start is not always the same as when finish, especially for long distance. If we are near the equator, heading at the beginning and at the end of travel can be almost the same. It is because of our position on the north and south poles are always about the same. For example a flight conducted along the equator toward the east (heading 90 degrees). As long as the aircraft follows the equator and towards the east, in any position, the north pole is always on the left, and the south pole is always on the right of that aircraft.

Likewise, if we fly along the line of latitude. For example from the south pole to the north pole. During the trip, either at the start or near the destination, north pole position is always in front and the south pole is always in the back. So heading at the start and at the end of flight is almost the same 0 degree.

But if the journey is done over the pole, for example: the north pole, at the beginning of the trip heading 0 or 360 degrees. When passing over the north pole (90,0), the heading will change to 180 degrees.

For example: flights from Pulkovo International Airport, Saint Petersburg, Russia (59.800278, 30.262500) to the Ted Stevens Anchorage International Airport, Alaska, United States of America (61.17417, -149.99833). At Saint Petersburg, Russia after take off; initial heading 0.147 or to the north, when approaching Anchorage just before landing, heading is changed to 179.844 or heading to the south. Even though the flight is following straight line. And the shortest distance between Saint Petersbug to Anchorage is over the north pole.

So to explain the flight path, mid point needs to be calculated, ie the point in the middle of a trip. Saint Petersburg flight towards Anchorage has mid point at (89.309101, 36.265637). Heading at the mid point is 6,130 degrees.

Another example: a flight from Bordeaux Airport, Merignac, France (44.830309, -0.701237) to Toronto Pearson International Airport, Mississauga, Ontario, Canada (43.67768, -79.624958). After takeoff in Bordeaux, flight will be heading to 298.900 degrees. Half way will be at mid point (51.605128, -40.625340) and heading will become 268.540 degrees. Before landing in Toronto, the final heading is 239.258 degrees. So after take off flight heads to approximately north-west, at the mid point heads to the west, while approaching Toronto flight heads to approximately the southwest.

Both cities Bordeaux and Toronto are at nearly the same latitude line, which is about 44 degrees north latitude. But because the shape of the globe, the shortest distance between the two cities does not follow that latitude line. The shortest distance between Bordeaux and Toronto is over the mid point located at 51.6 degrees north latitude, about 8 degrees more to the north of the latitude of Bordeaux and Toronto. If flying from Bordeaux to Toronto follows the line of 44 degrees north latitude, it will always be a constant heading of about 270 degrees. The north pole will always be on the right, and the south pole is always on the left.

The picture below is a globe that is stretched into two dimensions or flat, showing that the latitude (blue) is always parallel to the equator (red, latitude 0). The compass direction of the absolute north-south pole (not the earth's magnetic pole) always follows longitude (black).


An airplane from Seoul Incheon International Airport (South Korea, Republic of Korea) (37.460395, 126.440717). The aircraft was headed for Amsterdam Airport Schiphol (Netherlands) (52.310545, 4.768124). Seen in the Google maps image below.


Although the two airports have almost the same latitude coordinates of around 37-52 degrees, the flight does not follow a parallel line with the equator, namely: passing over China, Kyrgyzstan, Kazakstan, etc.. Because the earth is like a ball, not flat, the closest distance is over China, Mongolia, Rusia, etc..

Then it will be read on the compass on the aircraft: the initial heading from Seoul flight to Amsterdam is 327.710 degrees, the heading at the mid point changes to 227.186 degrees, and at the final point near Amsterdam is 289.147 degrees. Although the aircraft is actually flying straight in the shortest path, following the curvature of the earth.

Earth radius used is 6,378.14 km and it is radius of the earth at the equator. Earth radius number can be adjusted for better accuracy because the earth is not perfectly round. The average value of earth radius is 6371 km. While the Earth's polar radius is 6,356.7523 km.

Read also calculating land lot area by GPS coordinates.

If using Google Maps, then the calculation result can be copied and paste in the Search box on Google Maps, then press the Search button. Google Maps will show the intended point on the map.

For Muslims, this heading formula can be used to calculate and find the qibla direction. By entering the coordinates of your position as the starting point, and the coordinates of the Kaaba (al-Kaʿbah al-Musharrafah, Mecca, Saudi Arabia) as the end point. For example: the qibla direction from Delhi (India) is:

Start: latitude 28.6100, longitude 77.230000 Delhi
End : latitude 21.4225, longitude 39.826167 Kaaba

The formula on the Excel sheet will produce an initial heading  266.614 degrees, or about west direction. This angle is used as the qibla direction from a position in Delhi.


Another example:

Start: latitude 23.5000, longitude 54.500000 Dubai
End : latitude 21.4225, longitude 39.826167 Kaaba

The calculation of the Excel formula will produce an initial heading of 264,154 degrees, or around the west for the qibla direction at Dubai.